Market Intelligence Platform
Every data system has a label problem. Official categories describe what a company was, not what it's exposed to right now. A gaming company pivots its treasury to Ethereum - it still says "Electronic Gaming" in every database. A photonics maker, a memory chip supplier, a data-centre cooling firm, and a power equipment company all start moving together - placed in different sectors by every standard classification scheme, driven by the same underlying bet on AI infrastructure. Industry labels like GICS and SIC are slow to change by design. But risk doesn't wait. When a company's actual exposure diverges from its label, standard tools miss it - and so does anyone relying on them. The platform is built around one question: what is this company actually, right now? 5,200 US stocks reclassified by real risk exposure - extracted from regulatory filings by AI - with unusual price moves logged daily and processed to surface the narratives that explain why stocks move together, and when that changes.
The platform view
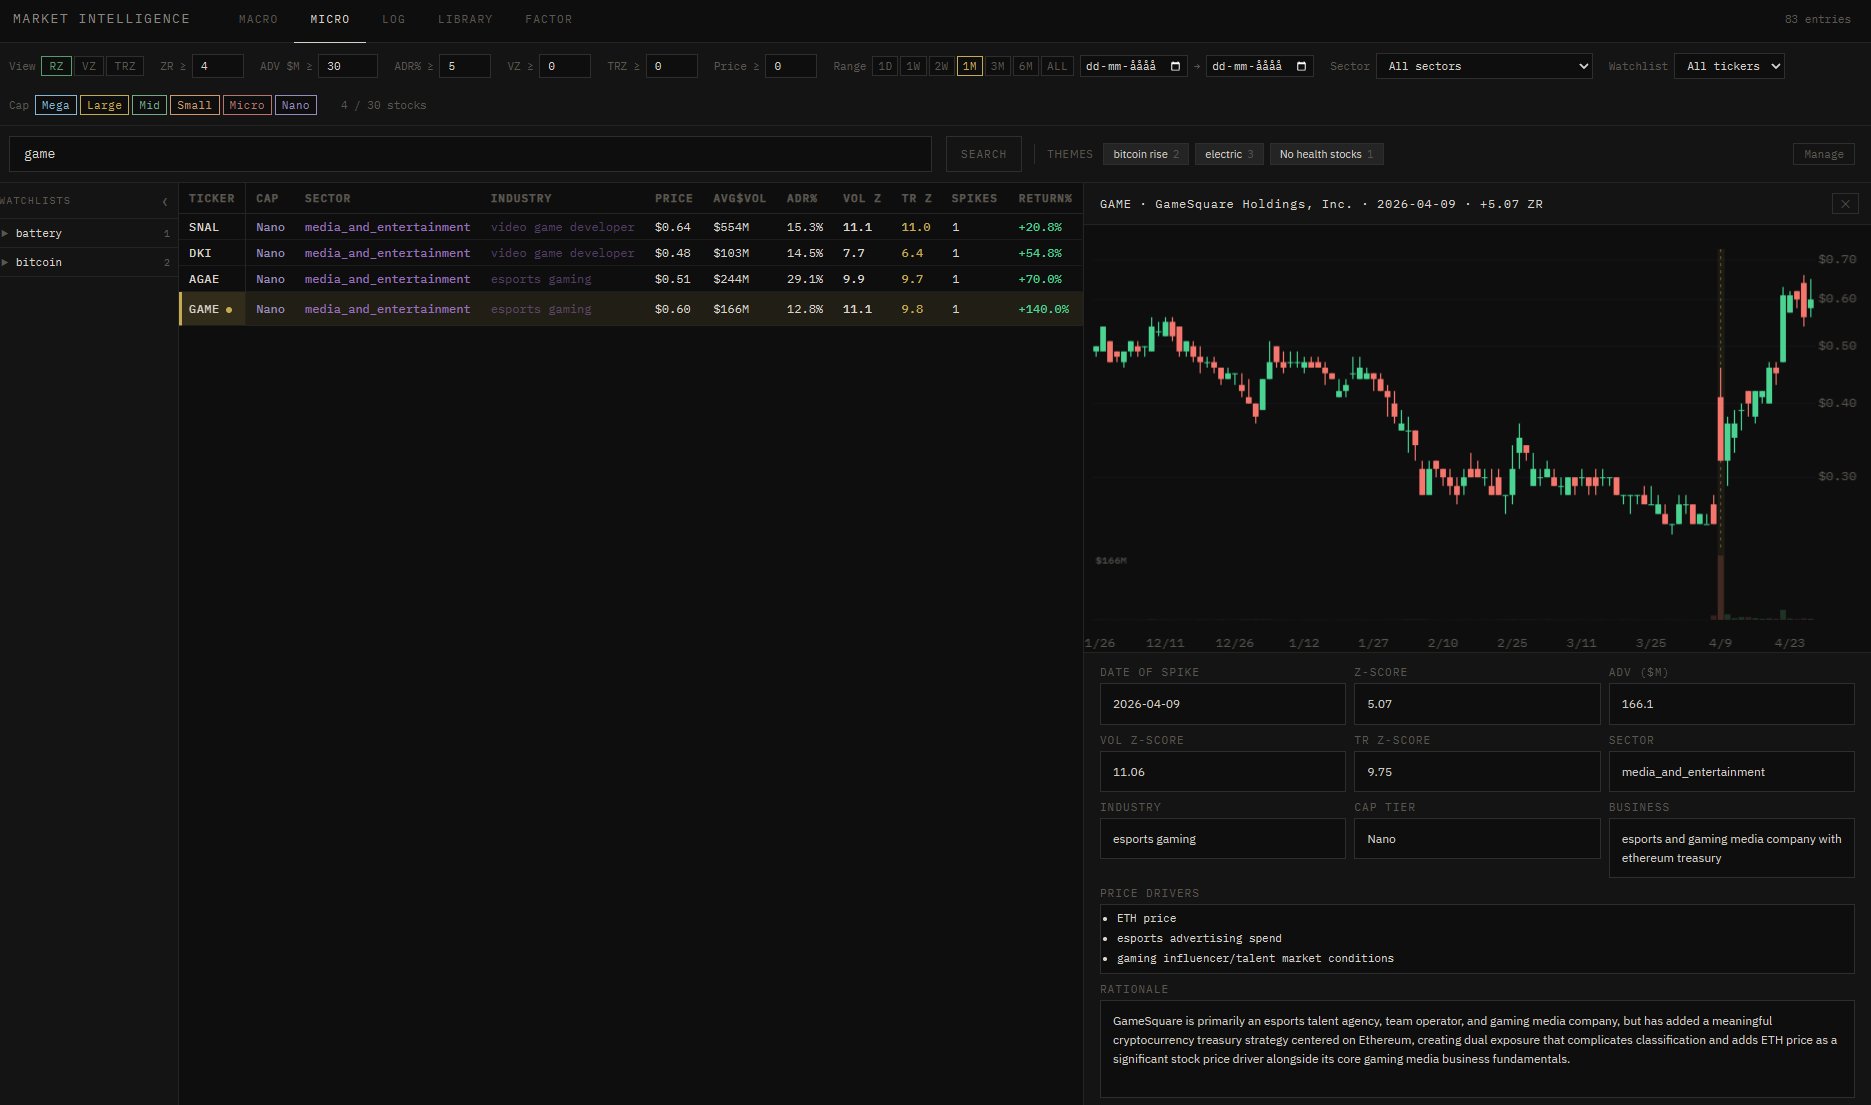
GameSquare is labelled an esports gaming company - reasonable on the surface. But the platform read its regulatory filing and found something the label misses: the company holds Ethereum as a treasury asset, meaning its stock moves with crypto prices, not just gaming ad spend. No standard classification captures both at once.
- Ticker
- GAME
- Sector
- media_and_entertainment
- Industry
- esports gaming
- Key driver
- ETH price
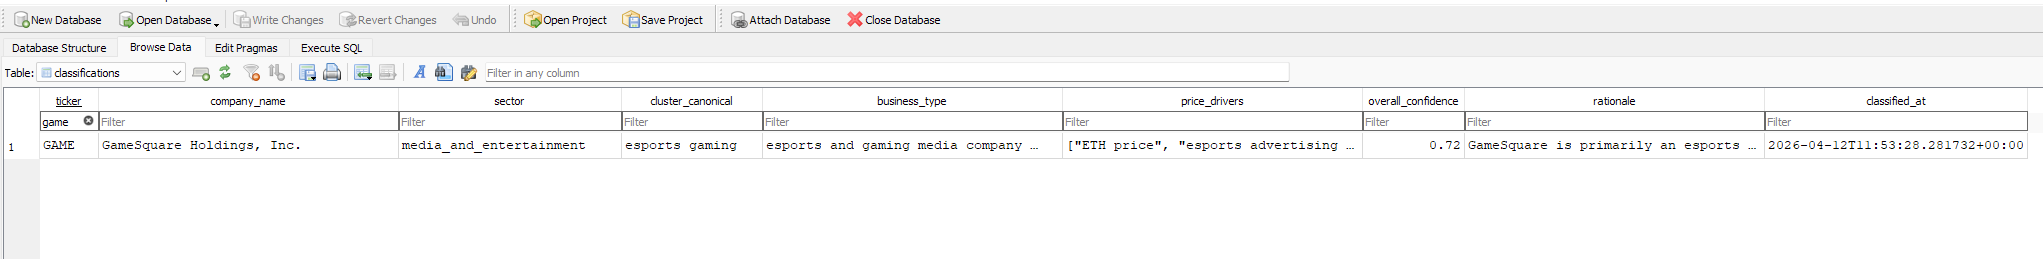
What the system extracted
The raw classification data shows confidence at 0.72 - the system flagging that this company doesn't fit cleanly into one category. The price drivers were extracted directly from Item 1A of the 10-K filing. The rationale explains why: dual exposure to both gaming fundamentals and ETH price complicates any single label.
- Confidence
- 0.72
- Source
- 10-K Item 1A
- Signal
- dual exposure
- Classified
- 2026-04-12
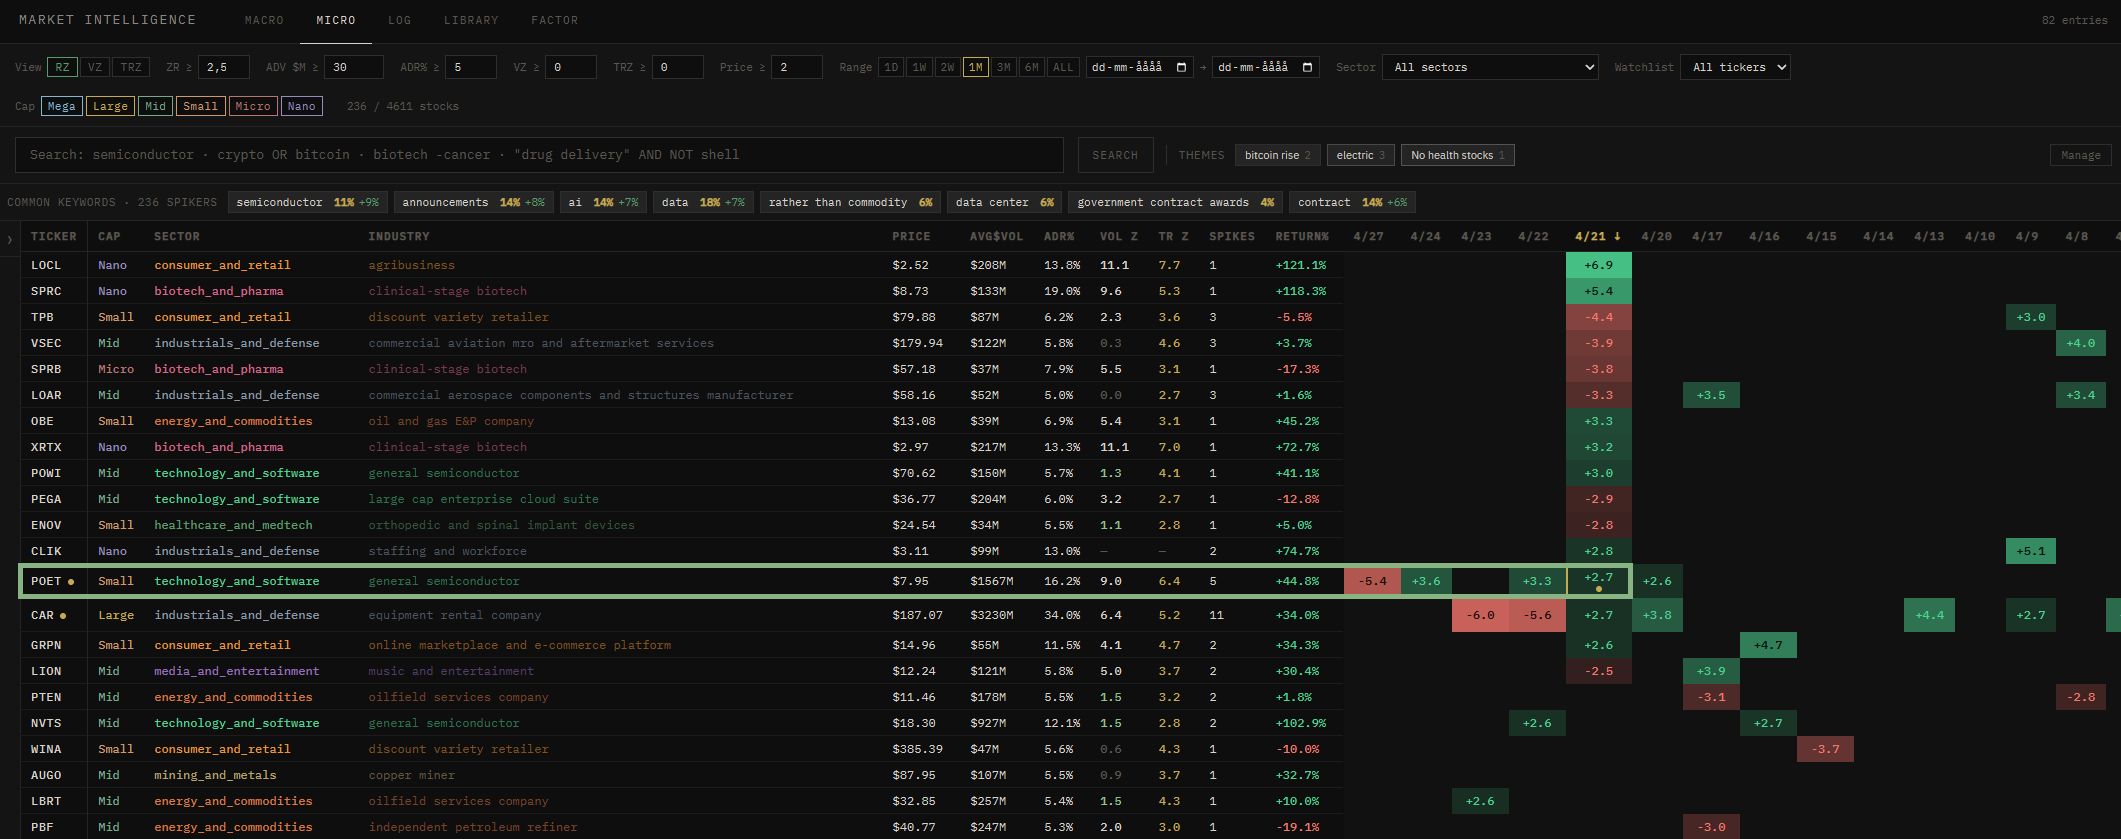
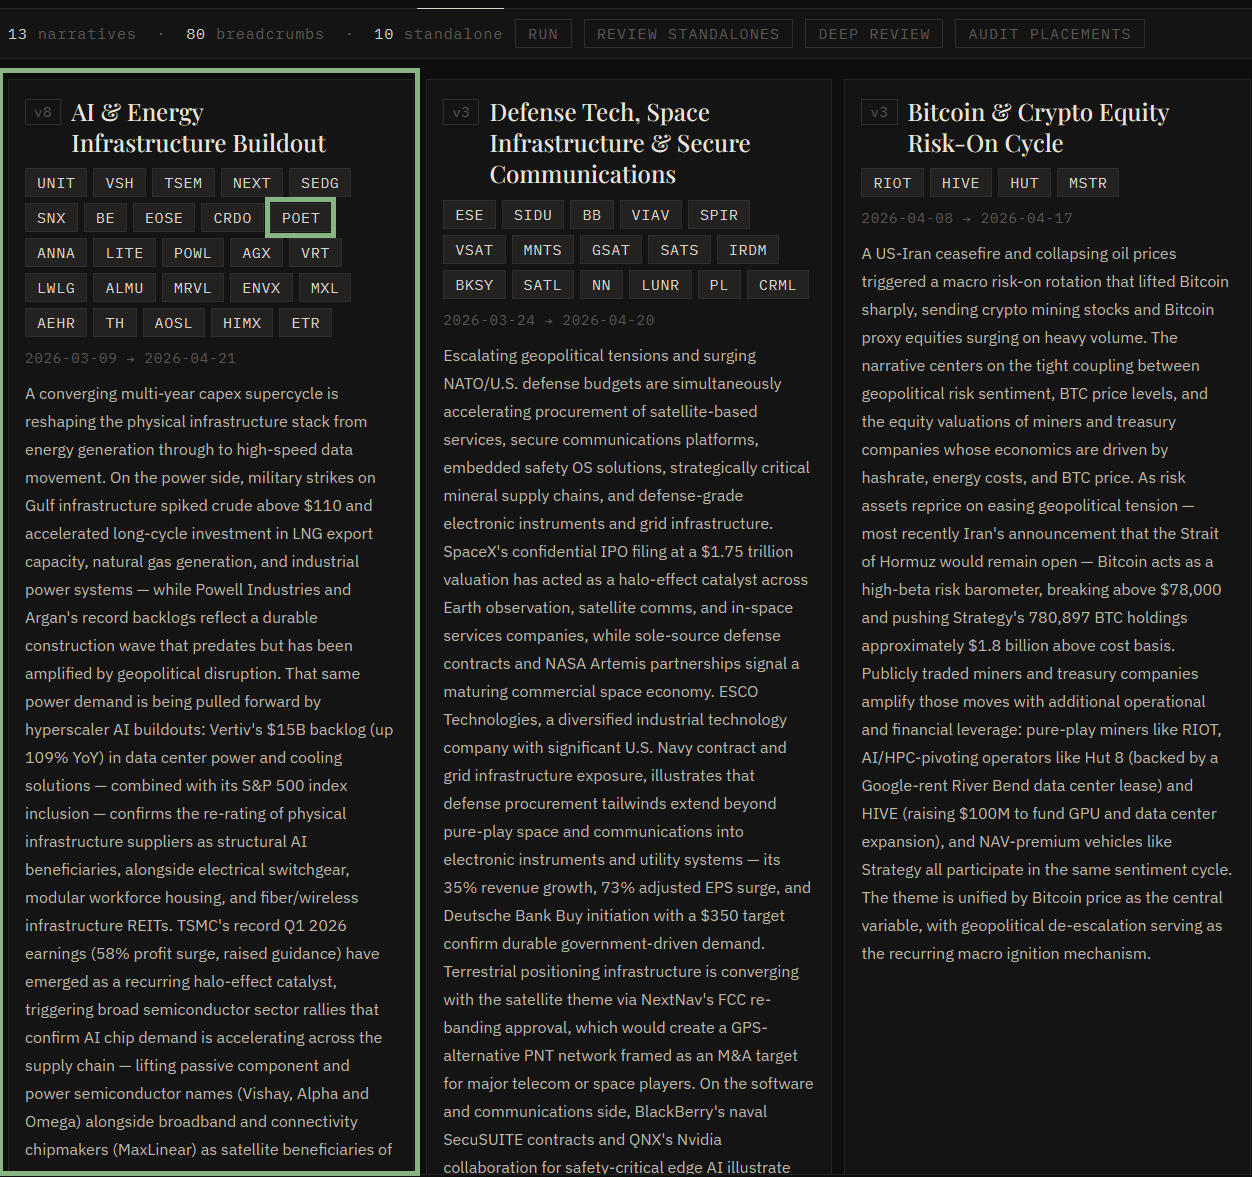
Spot the anomaly
Every stock is scored daily against its own history. When something moves far outside its normal range, it rises to the top - filterable by sector and company size.
- Ticker
- POET
- Z-score
- 2.7
- 1-month return
- +44.8%
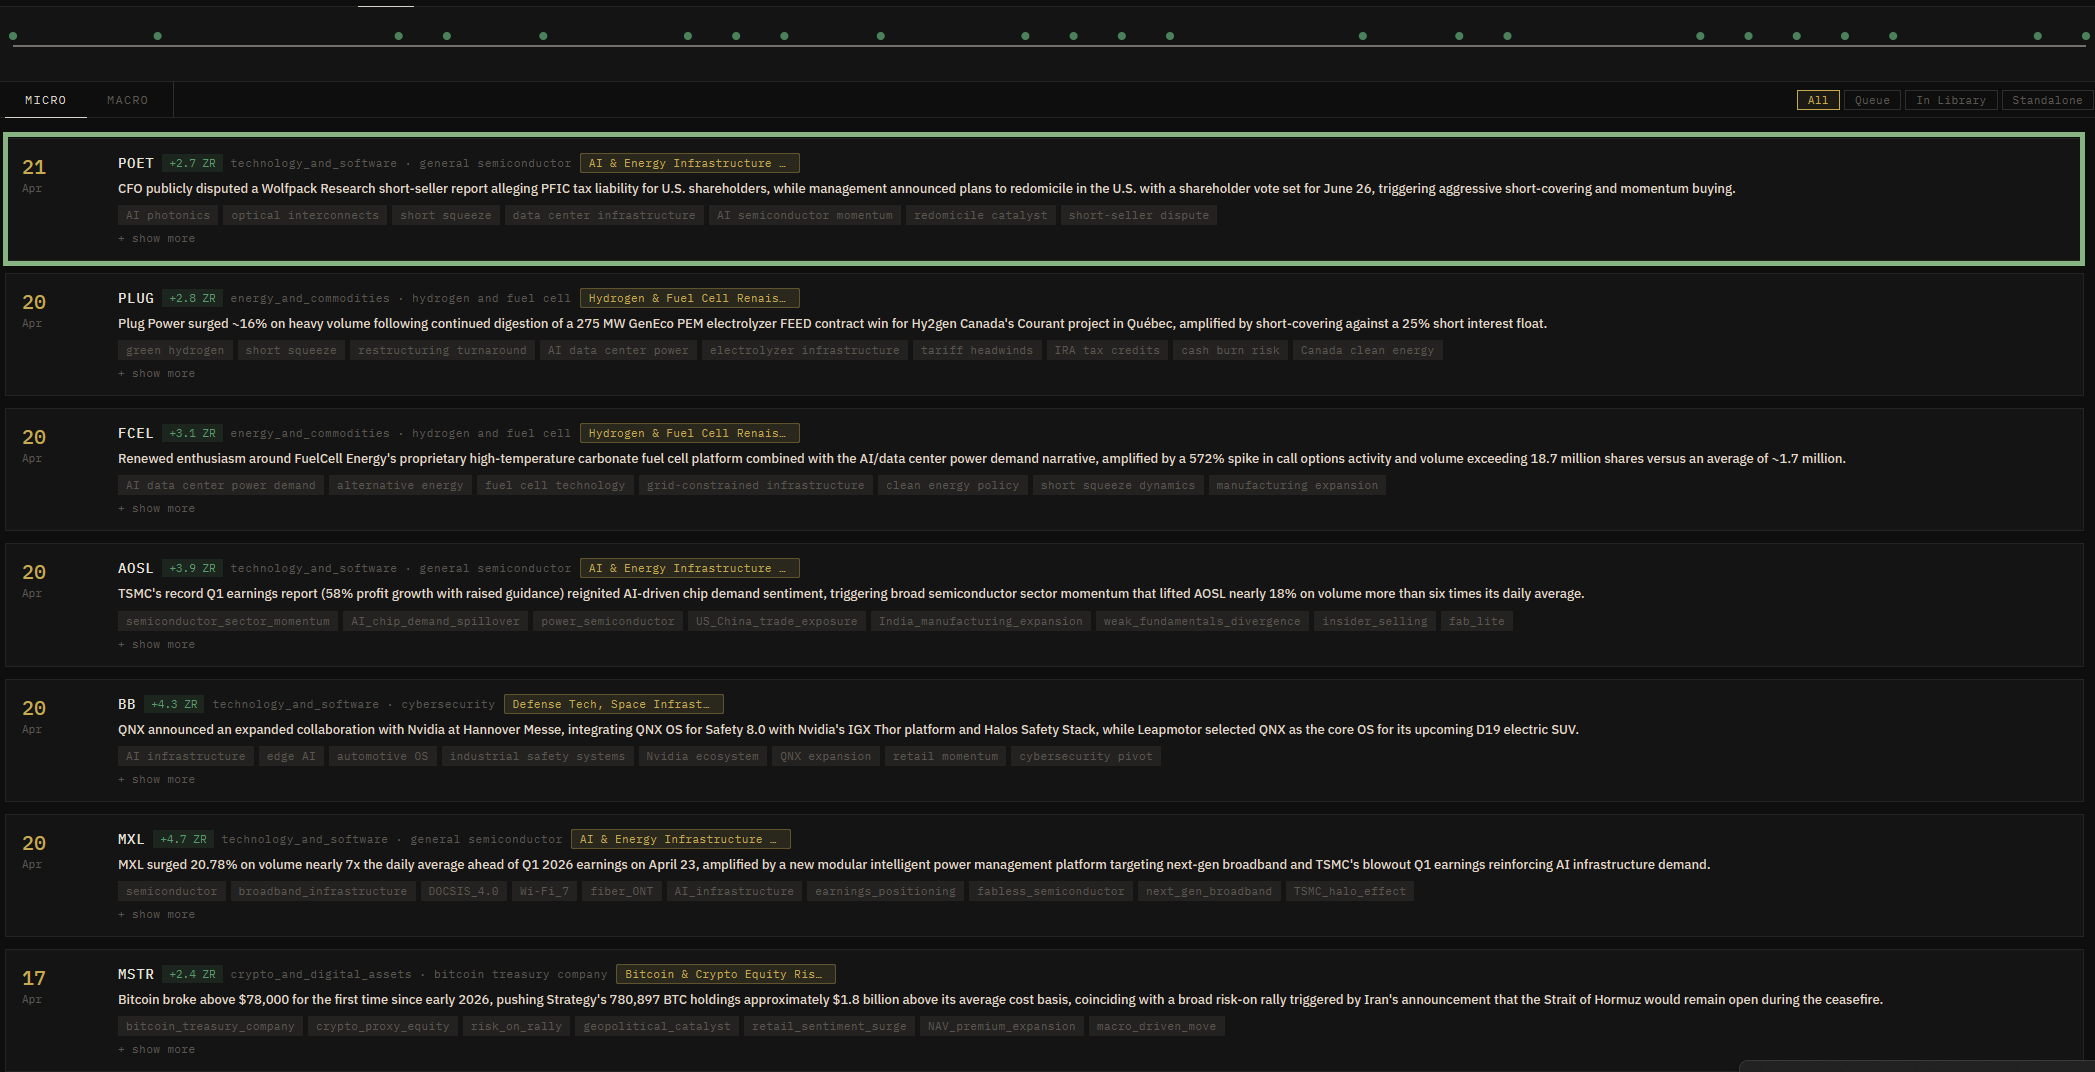
Read the event
Every anomalous move is logged with an AI-generated summary and keyword tags - capturing what drove it, and which narrative thread it belongs to. The trail stays readable weeks later.
- Trigger
- CFO disputes short-seller
- Mechanism
- Short squeeze + redomicile
- Narrative link
- AI & Energy Infra
Surface the narrative
Co-moving stocks are clustered into evolving themes. POET joins 20+ tickers inside "AI & Energy Infrastructure Buildout" - a narrative Claude has versioned eight times since March.
- Active tickers
- 20+
- Version
- v8
- Running since
- 2026-03-09
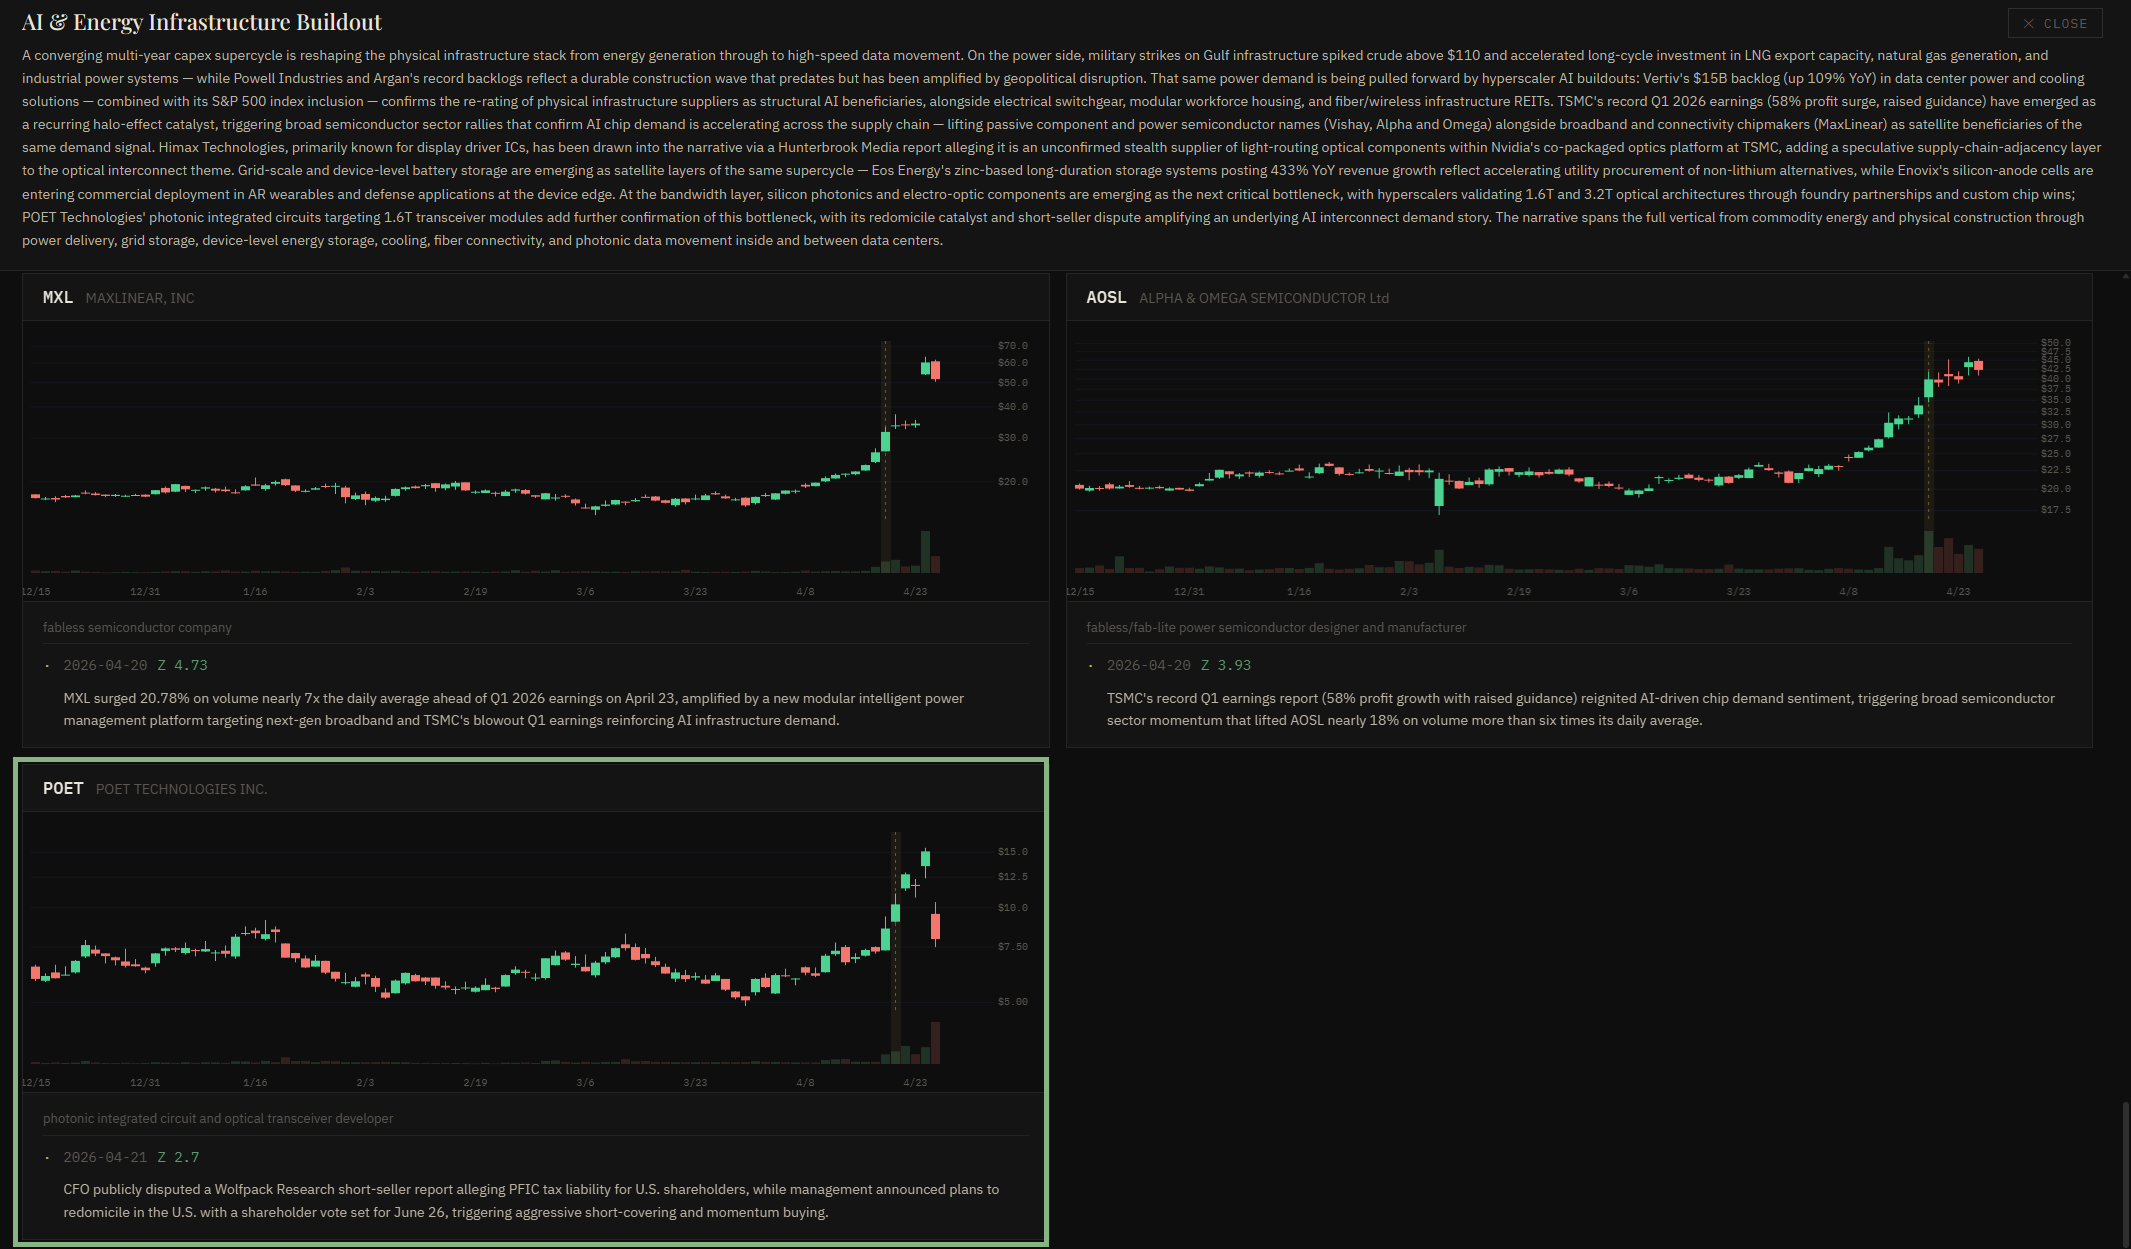
The full paper trail
Open any narrative to see the full thesis, candlestick charts for every member stock, and the event that pulled each one in - readable long after the move has passed. What the system shows isn't just that POET moved - it's that it moved as part of a theme that had been building for weeks. That context is the analysis.
- Stock shown
- POET Technologies
- Z-score at entry
- 2.7
- Trigger
- CFO disputes short-seller
- Date
- 2026-04-21